
3Q 15 Financial Results
Conference Call
Conference Call

Forward Looking Statement
2
This presentation contains express or implied forward-looking statements within the
Private Securities Litigation Reform Act of 1995 and other U.S. Federal securities laws.
This forward looking statement regarding our future growth, increased volumes and
demand in the markets in which we operate, the roll out of our new All-In-One wireless
platforms, our ability to penetrate the local fleet vertical market, our ability to diversify and
expand our customer base, continuing demand in our defense and aerospace business,
our ability to develop new customer relationships, our ability to meet the needs of our
existing customers, market interest and acceptance of our products, the introduction of
new products and our ability to provide our solutions to different applications, the timing
of pending U.S. federal rulemaking and the impact of the proposed rules on our business
and our future.Such forward-looking statements and their implications involve known and
unknown risks, uncertainties and other factors that may cause actual results or
performance to differ materially from those projected. The forward-looking statements
contained in this press release are subject to other risks and uncertainties, including
those discussed in the "Risk Factors" section and elsewhere in the Company's annual
report on Form 10-K for the year ended December 31, 2014 and in subsequent filings
with the Securities and Exchange Commission. Except as otherwise required by law, the
Company is under no obligation to (and expressly disclaims any such obligation to)
update or alter its forward-looking statements whether as a result of new information,
future events or otherwise.

Presenters
3
Eyal Leibovitz
Chief Financial Officer
David Lucatz
Chairman of the Board and CEO
Shai Lustgarten
CEO of Micronet Ltd.
Tali Dinar
CFO of Micronet Ltd.

4
3rd Quarter Overview
■ Quarterly revenue consistent with introduction of new full
connectivity product line
connectivity product line
■ Revenues decreased slightly sequentially compared to Q2
■ Expect >60% sequential revenue growth and positive EBITDA in 4Q15
■ U.S.-based sales team generating substantial interest in A317
product line
product line
■ Strong MRM backlog growth
■ Significant order pipeline for All-In-One solution
■ Focus on large and growing local fleet market
■ Continued diversification of customer base

5
Recent Developments
MRM
■ Partnership with MiX Telematics to provide TREQ 317 rugged Android tablet for
use with the MiX Rovi in-cab display, developed as solution for compliance with
Electronic Logging Device (ELD) Mandate
use with the MiX Rovi in-cab display, developed as solution for compliance with
Electronic Logging Device (ELD) Mandate
■ One of only five companies selected by New York City’s Taxi & Limousine
Commission to participate in “Vision Zero” Vehicle Safety Technology pilot
program
Commission to participate in “Vision Zero” Vehicle Safety Technology pilot
program
Aerospace/Defense
■ $1.85 Million order from Israeli Multinational Aerospace Contractor for
development and production of Mobile Command & Control Centers;
breakthrough product expected to drive growth in A&D division
development and production of Mobile Command & Control Centers;
breakthrough product expected to drive growth in A&D division
Several Key Announcements Following Close of 3Q15

Positive Outlook
6
MRM
■ Local fleet market expected to grow 37% between 2014 and 20161
■ Expect orders for wireless All-In-One products to build
Aerospace/Defense
■ Continued reliance on missile defense systems supports potential demand for
our missile defense offerings
our missile defense offerings
■ Expect significant international demand for new Mobile Command & Control
Centers
Centers
■ Anticipate > 60% sequential revenue growth with positive EBITDA in 4Q2015
■ Continuing strong potential for our systems and products across both
divisions
1 Licht and Associates study (November 20, 2013)
Macro Trends
4Q2015 and Beyond
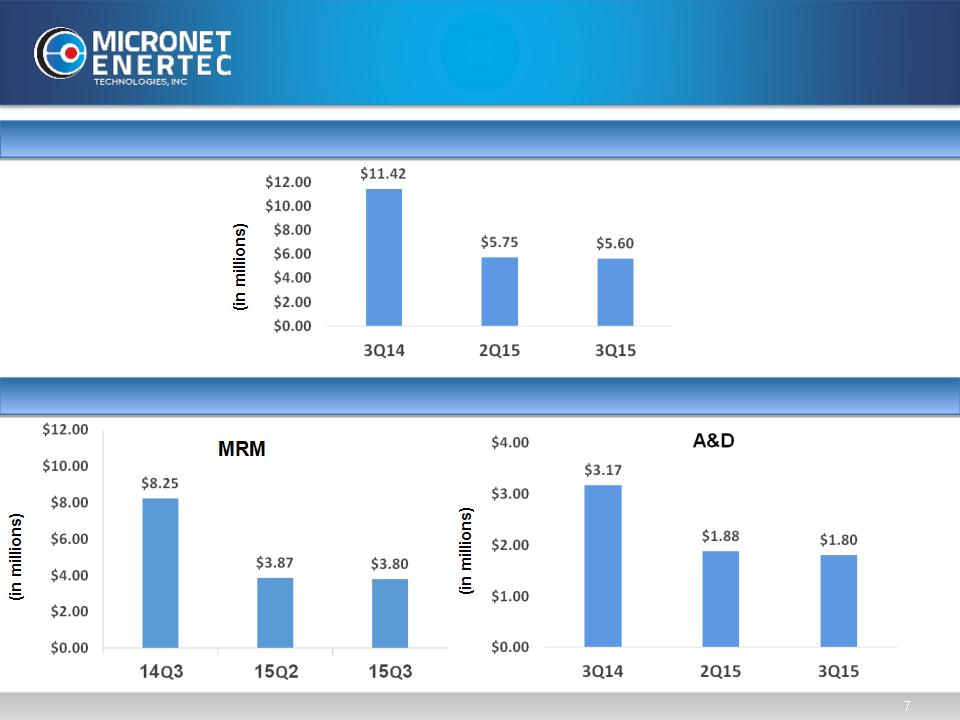
3Q14 vs 3Q15 Revenues
Sales Breakdown
Consolidated revenue for the quarter
8
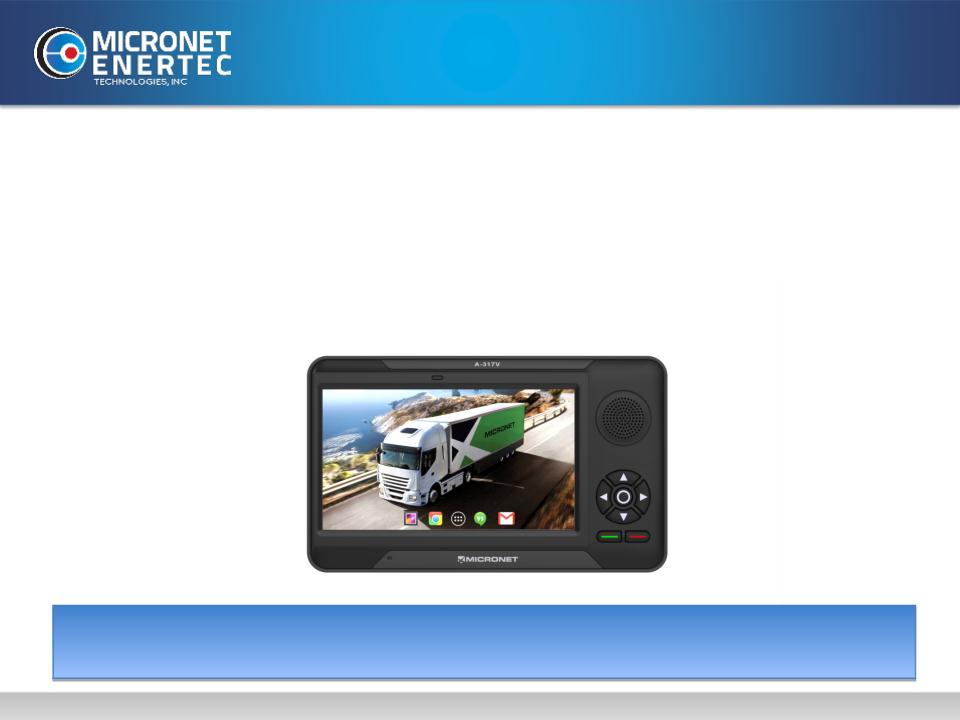
Next Generation A-317 Tablet
■ A-317 “All-In-One” tablet is a significant technology
advancement
■ Rugged, integrated tablet solution
■ Offers 3.5G/4G LTE, Bluetooth and Wi-Fi applications
■ Potential benefit from upcoming ELD mandate (effective Year End 2015)
First Totally Connected Product; Transforms Product Offering
9
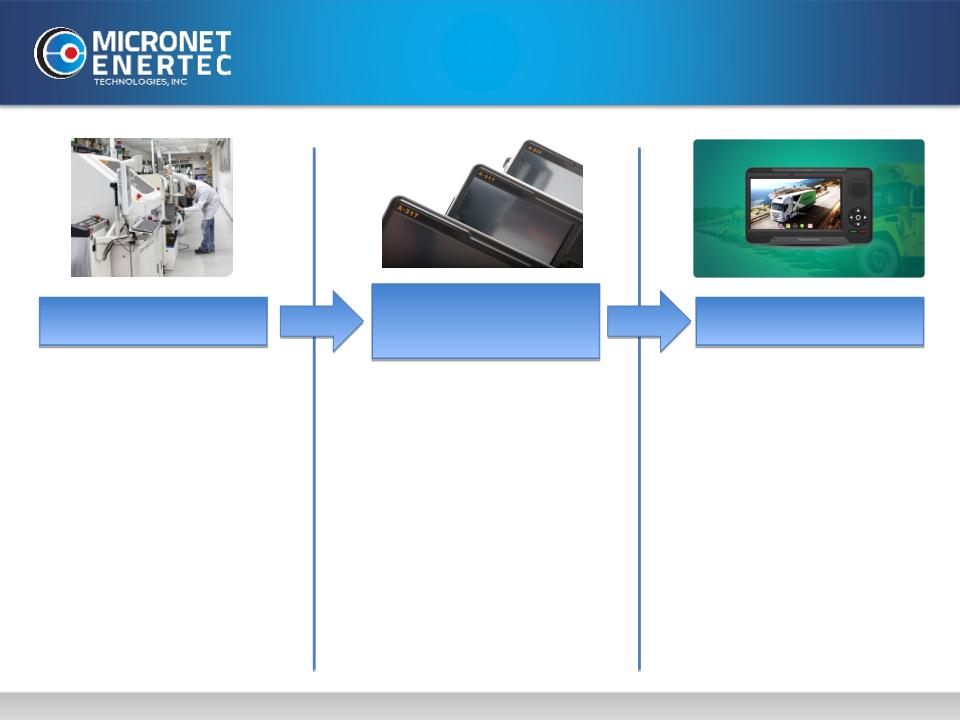
A-317 Tablet Roll Out
Product R&D
Carrier Certification;
Testing & Approval
Adaptation & Orders
● Completed
● Ongoing refinement
with customers
with customers
● Continue to invest
significantly in
product
improvement and
customization
significantly in
product
improvement and
customization
Carrier Certification
● Verizon complete
● AT&T in progress
● In discussions with
additional carriers
Customer Testing/Approval
● Multiple customers
currently testing new
product
● Total of ~16,000 units to
be sold by the end of
the year.
be sold by the end of
the year.
● $1.4M public
transportation
purchase order in July
transportation
purchase order in July
● $950K fleet management
initial purchase order
in June
initial purchase order
in June
● $4M+ school bus
purchase agreement in
May 2015
purchase agreement in
May 2015

10
Income Statement Highlights
(in 000s except share and per share data)
(in 000s except share and per share data)
|
|
Three Months Ended September 30,
|
Nine Months Ended September 30,
|
||
|
|
2015
|
2014
|
2015
|
2014
|
|
|
|
|
|
|
|
Revenues
|
$ 5,556
|
$ 11,415
|
$ 16,982
|
$ 23,568
|
|
Cost of revenues
|
4,434
|
8,546
|
12,275
|
16,790
|
|
Gross profit
|
1,122 |
2,869
|
4,707 |
6,778
|
|
Gross profit margin
|
20%
|
25%
|
28%
|
29%
|
|
Operating expenses:
|
|
|
|
|
|
Research and development
|
485
|
546
|
1,951
|
2,164
|
|
% of sales
|
8%
|
5%
|
11%
|
9%
|
|
Selling and marketing
|
395
|
449
|
1,214
|
1,209
|
|
% of sales
|
7%
|
4%
|
7%
|
5%
|
|
General and administrative
|
1,169
|
1,738
|
3,407
|
4,219
|
|
% of sales
|
21%
|
15%
|
20%
|
18%
|
|
Amortization of intangible assets
|
282
|
306
|
889
|
557
|
|
Total operating expenses
|
2,331
|
3,039
|
7,461
|
8,149
|
|
% of sales
|
42%
|
27%
|
44%
|
35%
|
|
|
|
|
|
|
|
Net income (loss) attributable to MICT
|
(1,263)
|
(506)
|
(2,557)
|
(2,111)
|
|
Basic and diluted income (loss) per share
|
(0.22)
|
(0.09)
|
(0.44)
|
(0.36)
|
|
Weighted average common shares outstanding:
|
5,865,221
|
5,831,246
|
5,838,873
|
5,831,246
|

Non-GAAP
(in 000s except share and per share data)
(in 000s except share and per share data)
11
|
|
Three Months Ended
September 30,
|
Nine Months Ended
September 30,
|
||||||
|
|
2015
|
|
2014
|
2015
|
|
2014
|
||
|
GAAP net loss attributed to MICT
|
|
(1,263)
|
|
(506)
|
|
(2,557)
|
|
(2,111)
|
|
Total amortization of acquired intangible assets
|
|
177
|
|
212
|
|
558
|
|
348
|
|
Change in fair value of call options and warrants
|
|
0
|
|
0
|
|
0
|
|
307
|
|
Amortization of UTA's note discount and related
expenses |
|
0
|
|
6
|
|
0
|
|
61
|
|
Stock-based compensation
|
|
82
|
|
6
|
|
254
|
|
19
|
|
Expenses related to the purchase of business
|
|
0
|
|
79
|
|
-
|
|
369
|
|
Income tax-effect of above non-GAAP adjustments
|
|
(7)
|
|
(11)
|
|
(24)
|
|
(26)
|
|
Total non-GAAP net income (loss) attributed to
MICT |
|
(1,011)
|
|
(214)
|
|
(1,769)
|
|
(1,033)
|
|
Non-GAAP net income (loss) per diluted share
|
|
(0.17)
|
|
(0.04)
|
|
(0.30)
|
|
(0.18)
|
|
Shares used in per share calculations
|
|
5,865,221
|
|
5,831,246
|
|
5,838,873
|
|
5,831,246
|
|
GAAP net income (loss) per diluted share
attributable to Micronet Enertec Technologies, Inc. |
|
(0.22)
|
|
(0.09)
|
|
(0.44)
|
|
(0.36)
|
|
Shares used in per share calculations
|
|
5,865,221
|
|
5,831,246
|
|
5,838,873
|
|
5,831,246
|
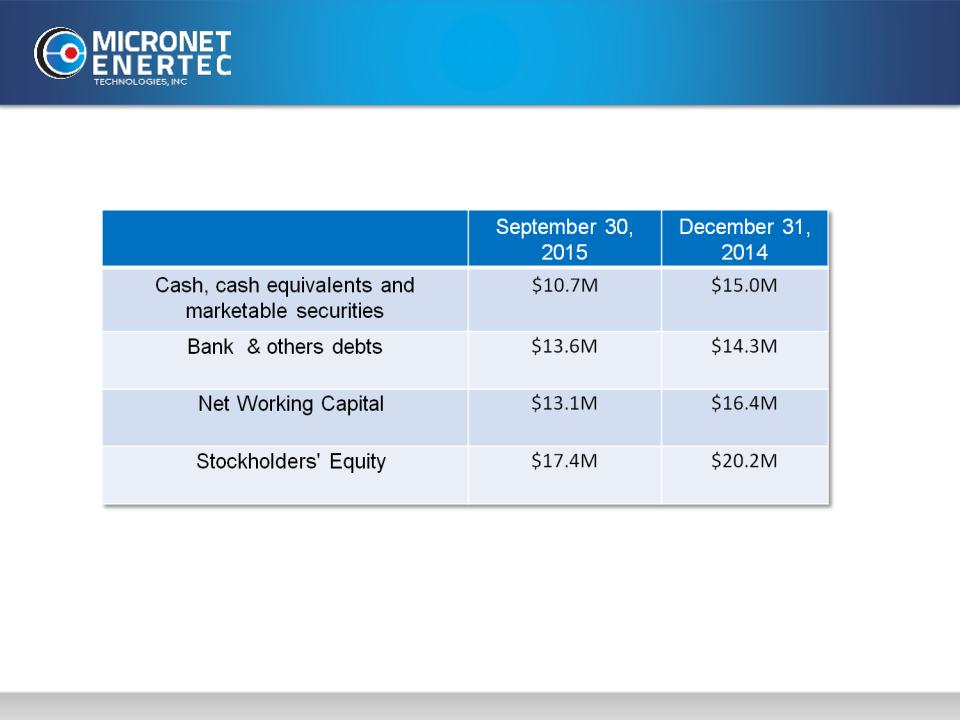
Strong Balance Sheet
12
.
ELD Mandate Opportunity
13
New regulation starting in 2017 mandates all truck drivers to keep records of
hours of service (HOS).
hours of service (HOS).
● Cannot drive over 11 hours per day.
● Required rest periods.
Electronic Logging Devices (ELDs)* connect to engine and replace paper
logbooks.
logbooks.
Law being put in place requiring ELDs.
* Federal Motor Carrier Safety Administration:
“Electronic Logging Devices and Hours of Service Supporting Documents”- March 2014
July ‘12
Passed by
congress
congress
2017
Law enforced
2015
Law enacted
June ‘14
Comment period
closed
closed
2015 500,000 ELD equipped trucks
2017 ~2.6 Million trucks will require ELD
Our tablets are fully compliant with the regulation
requirements
requirements

Thank You
14
Q & A